What Is the Regression in Machine Learning Explained
-
 Softsonix Team
- Jan 04, 2024
- 4 Min Read

Credit - Unsplash
In this article, we explain that the way machine learning techniques predict outcomes from available data is called regression in machine learning. It uses factors to predict continuous values, like predicting a car's mileage based on various features. Linear regression is a basic but widely-used method, while polynomial regression fits curves to complex data. To avoid errors, it's crucial to manage variance and bias. Ultimately, regression aims to create accurate predictions based on data patterns.
In machine learning, regression analysis is important. It's a type of supervised learning where an algorithm learns from input and output labels. It helps create a strong link between different factors and their impact on something else.
Imagine you are going to buy a car and already decided on mileage as a main factor. If you want to predict liter per km, You must know the car's average mileage, maintenance, accuracy, and other factors because on these bases you will get a perfect car for yourself. When you start comparing the features of the car, you are doing regression analysis. We always represent the regression method as, = f(X)$. Where Y=MPG (Max Planck Society), X= Input Features, and $f$= The curve to predict beneficial or not.
From the example of a car, MPG means that the fuel economy of an automobile is related to the distance traveled by the vehicle and the amount of fuel consumed. Consumption can be expressed the amount of fuel needed to cover the distance or the distance covered per unit amount of fuel consumed.
It means that regression analysis involves mathematical methods that allow data scientists to predict a continuous outcome (y) based on the value of one or more predictor variables (x). Linear regression is the most popular form of regression because it is easy to use in forecasting and prediction during analysis.
Test a Machine Learning Regression Algorithm
Let's say, you have developed an algorithm that can predict the temperature for the upcoming season. Buy As you know, forecasting temperature depends on various factors such as humidity, atmospheric pressure, air temperature, and wind speed, so you should consider the variance and bias before making an accurate forecast.
Also Read -

VARIANCE
Variance is a variable that is used to estimate the changes in target function with various training data. As you learn above target function $f$ establishes the relation between the input (properties) and the output variables (predicted temperature) so by a different dataset is used the target function needs to remain stable with little variance. It means the given data and model should be generic because predicted temperature changes are based on the variations in the training dataset. If you should avoid false predictions, make sure the variance is low. For this reason, you should generalize the model to unseen characteristics of the temperature data.
BIAS
To learn the wrong thing by not caring about information and data with algorithm's tendency called Bias. If you want to accurate your model, bias needs to be low because if there are any inconsistencies in the dataset, bias will be high and the prediction will be wrong. So you should avoid any type of inconsistencies in the dataset like missing values, fewer numbers, tuples, or errors.
There are two other metrics, accuracy and error. Error means, There are differences between the actual value and the predicted value, which is estimated by the model. Accuracy is a fraction of the predictions that we got right from the model.

How to Achieve Low Variance and Bias
It is expected to have low error, low variance, and low bias from an ideal model. If we want to achieve this, we should partition the dataset into train and test datasets after this model will then learn patterns from the training dataset and the performance will be evaluated on the test dataset.
What is overfitting and underfitting
Overfitting: When the curve derived from the trained model then passes through all the data points and the accuracy on the test dataset is low caused by high variance called overfitting.
Underfitting: if the model performs well on the test data but with low accuracy on the training data, this is called underfitting.
Simple Linear Regression in Machine Learning
It sounds simple, but it is one of the simplest yet powerful regression techniques in machine learning. It has two functions that help to predict the output from trained samples by fitting a straight line between those variables, one input ($x$) and one output variable ($y$).
Mathematically, it is represented by this equation:
$$y = mx +c$$
Where,
$x$ = Independent Variable (Input),
$y$ = Dependent Variable (Output)
$m$ = Slope
$c$ = Intercept.
This mathematical representation is called the Liner equation.
Example: Let's assume a liner equation with two variables, 3x+2y=0
Solution: You will find the two values upon defection, x= -2, y=3.
When put in the formula, We replace x with -2 and y with +3, the equation is true and we get 0.
$$y = mx +c$$
$$3 (-2) + 2 (3) = 0$$
A linear equation is always a straight line when drawn on a graph.
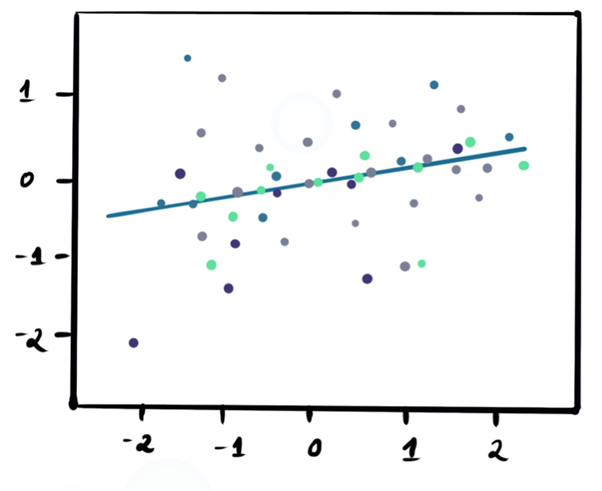
In a simple linear regression, the slope and intercept are the coefficient and bias. These act as parameters that affect the position of the line being plotted between the data.
Imagine you have plotted the data points in different colors, below is the image that shows the best-fit line drawn using linear regression.
Polynomial Regression in Machine Learning
While the linear regression model can understand the patterns of a given dataset by fitting a simple linear equation, it may not be accurate when dealing with complex data. In those instances, we need to come up with curves that fit the data rather than lines. One approach is to use polynomial models. Here, the degree of the equation obtained from the model is greater than one. In mathematics, a polynomial model is shown by:
$$Y_{0} = b_{0}+ b_{1}x^{1} + ... b_{n}x^{n}$$
Where $Y_{0}$ is the predicted value for the polynomial model.
Regression coefficients $b_{1}$ to $b_{n}$ for each degree.
A bias of $b_{0}$.
If n=1, then you can say the polynomial equation is linear.

Also Read -

Regularization
Using polynomial regression, we see how curved lines fit to data, but they also sometimes result in inaccurate predictions because they fail to explain the input. For example, if your model is a fifth-degree polynomial equation trying to fit data points obtained from a quadratic equation, it will try to update all six coefficients (five coefficients and one bias), leading to overfitting. It will be done. By using regularization, we improve the fit so that the accuracy of the test dataset is better.
Conclusion
A supervised machine-learning technique used to predict continuous values is called Regression in machine learning. The ultimate goal of a regression algorithm is to create a line or curve of best fit between the data. The three main metrics used to test trained regression models are variance, bias, and error.
For All Image Sources:
https://builtin.com/data-science/regression-machine-learning